An Extended Cycle: Watch the Inflation Path


Central banks are signaling a desire to start cutting rates. Loomis Sayles’ Lynda Schweitzer doesn’t see evidence of a decisive turn for the worse in the economic cycle.
The Case for Disinflation
- Core goods, energy, and food inflation back to pre-pandemic levels
- Labor market softening points to lower wage growth
- Zillow Observed Rents Index (as of 29/02/24) tapering off should lead to lower shelter Consumer Price Index
The Case for Higher for Longer
- Wage growth remains high, keeps core inflation above target
- An exogenous shock (e.g. oil price spike) could compound sticky services inflation
- Sticky services inflation and flare up in energy inflation forces the Federal Reserve (“Fed”) to stay restrictive
Outlook
As global central banks contemplate their next policy moves, the market continues to filter the signal from the noise. We believe we are approaching a policy turning point as key central banks are signaling a desire to start the rate cutting process. But we do not yet see evidence of a decisive turn for the worse in the economic cycle, especially in the US. This despite the cumulative amount of rate hikes we have seen that many, including us, believed would lead to a downturn late last year. The reasons for US resilience have been well documented,
so there is no need to rehash here. European and Chinese growth are showing signs of stabilizing, so without a catalyst or signs of imminent weakness, the economic cycle continues. As a team, we need to examine what this extended cycle means for our portfolios. Given the economic resilience, the focus for central banks, for the market and for us has shifted to the path of inflation.
As global managers, we are focused on the growth and inflation trajectories across our opportunity set, however, in this current data dependent environment the influence of the US data and the subsequent Fed path is hard to ignore. Markets have largely shaken off US headline and core inflation readings coming in higher than expected in January and February of this year, as evidenced by equity markets approaching record highs and corporate bond spreads narrowing towards their tightest levels. At his recent Federal Open Market Committee (“FOMC”) press conference, Chairman Powell made no decidedly dovish comments, but he also didn’t push back on the easing in financial conditions that has been spurred by the strong rally in US equities.
Mr. Powell also emphasized that the path back down to the central bank’s 2% annual inflation target can be a bumpy one. The Fed is looking for economic data to confirm the lower inflation readings from late 2023 and help provide policymakers with greater confidence that inflation is moving back down to that target in a sustainable manner.
Below we examine the main factors we are watching to determine if inflation is continuing its downward trend or staying higher for longer.
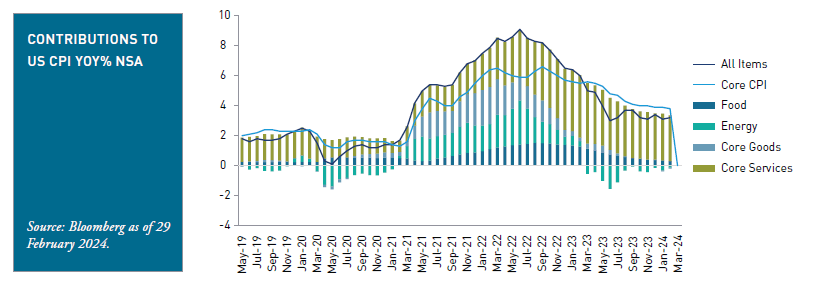
WAGES: MOSTLY SUPPORTS THE DISINFLATION VIEW
Core services inflation has proven to be a relatively sticky component of US inflation, as shown in this chart from Bloomberg.
Used with permission from Bloomberg. The chart presented above is shown for illustrative purposes only. Some or all of the information on this chart may be dated, and, therefore, should not be the basis to purchase or sell any securities. The information is not intended to represent any actual portfolio. Information obtained from outside sources is believed to be correct, but Loomis Sayles cannot guarantee its accuracy. This material cannot be copied, reproduced or redistributed without authorization.
In our view, both housing and non-housing service price rises are to blame. Because labor costs are the primary driver of non-housing services inflation, the Fed has appropriately kept a close eye on the wage setting process – the balance between the supply and demand for workers.
Layoffs and a rise in the unemployment rate often signal a weakened position for wage earners, yet the post-pandemic period has seen an unexpected lack of such stress. However, one measure from the US Labor Department’s Job Openings and Labor Turnover Survey (JOLTS) has maintained a fairly consistent relationship with wage growth. In this chart, we show wage growth compared to the quits rate (lagged by six months), which refers to employees who have left firms on their own accord. While the pandemic saw a spike in the number of workers who quit their jobs for better pay elsewhere, the recent decline in the quits rate may foretell a continued deceleration in wage growth, in our view.

Used with permission from Bloomberg. The chart presented above is shown for illustrative purposes only. Some or all of the information on this chart may be dated, and, therefore, should not be the basis to purchase or sell any securities. The information is not intended to represent any actual portfolio. Information obtained from outside sources is believed to be correct, but Loomis Sayles cannot guarantee its accuracy. This material cannot be copied, reproduced or redistributed without authorization.
SHELTER: MOSTLY SUPPORTS THE DISINFLATION VIEW
Shelter costs have also proven to be a stickier component of underlying inflation. Shelter accounts for 45% of the core CPI basket and includes two major items: rent of primary residence and owners’ equivalent rent. The Zillow Observed Rent index (ZORI) has recently shown to lead survey-based average rent indexes, including the shelter component of the CPI. And as observed here, the decline in the ZORI growth rate we believe suggests a deceleration in shelter inflation should continue.

The chart presented above is shown for illustrative purposes only. Some or all of the information on this chart may be dated, and, therefore, should not be the basis to purchase or sell any securities. The information is not intended to represent any actual portfolio. Information obtained from outside sources is believed to be correct, but Loomis Sayles cannot guarantee its accuracy. This material cannot be copied, reproduced or redistributed without authorization.
ENERGY: ONGOING RISK THAT CONTRIBUTES TO HIGHER FOR LONGER
While there are risks to the pace and scale of deceleration in both wages and shelter costs, an abrupt disruption to the disinflation story can come from higher velocity inputs like energy prices. Consumer sentiment on inflation tends to be heavily influenced by fuel prices, which have started to climb again and remain above pre-pandemic levels. An oil-related supply shock could exacerbate this situation and drive gas prices even higher in our view. We also note higher energy costs could apply significant upward pressure on other key elements of the CPI basket such as food and airfares, in turn leading to higher inflation readings, forcing the Fed to possibly tighten policy further.
WHAT DOES THIS MEAN FOR PORTFOLIO POSITIONING?
Please see the table below for a summary of potential positioning impacts across the major risk factors.
If inflation does resume its retreat to the Fed’s target, we think the Fed could start cutting rates in June/July. This scenario would potentially lend itself to strategies (rates or currency) that build incremental yield into the portfolio via nondollar and emerging market (“EM”) strategies as well as longer duration in developed markets, in our view. This is primarily how our positioning is currently leaning now but data has been mixed so we are not at our maximum positioning. As we build conviction that inflation is resuming its descent, we could add to these positions.
On the other hand, if inflation is stubborn and does not fall back towards the Fed’s 2% target, we think the Fed stays on hold and may keep the policy rate at the current 5.50% upper bound. This would not likely be a favorable environment for duration and the USD would likely rally, in our view.
In either path, portfolios would continue to maintain a lower credit beta profile, however, because credit spreads are very tight and thus, further spread narrowing and upside return potential is limited.

Source: Loomis Sayles as of 31 March 2024. † Please see our March 2024 newsletter on global corporates for more details on credit beta positioning: https://info. loomissayles.com/hubfs/GlobalBondTeamPerspectives-Mar2024.pdf
Views and opinions expressed reflect the current opinions of the Global Bond Team only, and views are subject to change at any time without notice. Other industry analysts and investment personnel may have different views and opinions.
Lynda Schweitzer is Portfolio Manager and Co-Head of Global Fixed Income at Loomis Sayles.
Matt Murray is an Investment Analyst at Loomis Sayles.
Important Disclosures
For wholesale investors only. Not suitable for distribution to retail investors.
Natixis Investment Managers Australia Pty Limited ABN 60 088 786 289, an Australian Financial Services Licencee (AFSL) no. 246830, is the issuer of this material in Australia and New Zealand and is authorized to provide financial services to wholesale clients and to provide general financial product advice to retail clients only.
Key Risks: Credit Risk, Issuer Risk, Interest Rate Risk, Liquidity Risk, Non-US Securities Risk, Currency Risk, Derivatives Risk, Leverage Risk, Counterparty Risk, Prepayment Risk and Extension Risk. Investing involves risk including possible loss of principal.
There is no guarantee that the investment objective will be realized or that the strategy will generate positive or excess return.
Markets are extremely fluid and change frequently.
Past market experience is no guarantee of future results. Diversification does not ensure a profit or guarantee against a loss.
Any investment that has the possibility for profits also has the possibility of losses, including the loss of principal.
This marketing communication is provided for informational purposes only and should not be construed as investment advice. Any opinions or forecasts contained herein reflect the subjective judgments and assumptions of the authors only and do not necessarily reflect the views of Loomis, Sayles & Company, L.P. Investment recommendations may be inconsistent with these opinions. There is no assurance that developments will transpire as forecasted and actual results will be different. Data and analysis does not represent the actual or expected future performance of any investment product. Information, including that obtained from outside sources, is believed to be correct, but Loomis Sayles cannot guarantee its accuracy. This information is subject to change at any time without notice. Market conditions are extremely fluid and change frequently.

Natixis Investment Managers’ multi-affiliate approach connects clients to the independent thinking and focused expertise...

Recommended for you
Cryptocurrency liquidity has become a cornerstone of sophisticated wealth management strategies, with real-time settleme...


Recent turbulence in global equity markets should serve as a sharp reminder for investors that volatility doesn’t send a calendar invite.


In a world where influence transcends borders, Bancara offers access, authority, and lifestyle integration for a new generation of global investors.


Starting out as a sole trader typically invites a heady mix of freedom and fear. You’ve chosen to back yourself, build u...